
This page used to tell you break-ins were spiking across Toronto, Mississauga and Brampton. Statistics Canada published the 2025 police-reported crime numbers on July 22, 2026. They say something more interesting than that, and more useful.
Here’s the honest version. Break and enter is down nationally, three years running. It also doesn’t lock your back door. The volume is still big, the decline isn’t spread evenly, and one of these three cities didn’t follow the trend at all.

The national picture: break-ins drove the whole decline
Canada’s Crime Severity Index came in at 75.0 for 2025, down 4.9%. The police-reported crime rate was 5,585 per 100,000 people, down 2.4%.
The interesting part is what caused the drop. Statistics Canada says breaking and entering had “the largest impact on the decline in the CSI in 2025.” Break and enter fell 11%, its third consecutive annual decline. Motor vehicle theft fell 16%. The homicide rate fell 16%, the biggest year-over-year drop since 1986.
So the thing this page used to call a spike is the single biggest reason crime severity went down.
Toronto, Peel and Hamilton compared properly
Most crime coverage mixes up geographies. Below are four police service figures from the same Statistics Canada table, plus the national number from the same July 22 release. It’s all measured the same way. Peel Regional Police covers both Mississauga and Brampton, so it’s the closest thing to a Mississauga number that exists at this level.
| Area | Crime Severity Index 2025 | Change from 2024 |
|---|---|---|
| Toronto | 59.98 | down 12.6% |
| Peel (Mississauga and Brampton) | 59.41 | up 4.2% |
| Hamilton | 62.21 | down 6.7% |
| Province-wide | 57.17 | down 6.2% |
| Canada | 75.0 | down 4.9% |
Toronto had one of the best years in the country. Peel went up while everything around it went down. That gap is the real story, and it’s the reason a single “GTA crime” headline is useless to you.
One note on the numbers, because it trips people up. These are police service figures, which cover the area a force actually polices. You’ll also see metro area figures quoted, which cover the wider commuter region and come out lower. Both are correct. They just measure different maps, so never compare one against the other.
Is Mississauga safer than Brampton?
It’s the most-asked question about these two cities, and the regional number can’t answer it. Peel Regional Police publish their occurrences with a city tag, so it can be split.
| Mapped break and enter occurrences | 2024 | 2025 | Change |
|---|---|---|---|
| Mississauga, all types | 1,628 | 1,388 | down about 15% |
| Brampton, all types | 980 | 1,180 | up about 20% |
| Mississauga, houses only | 659 | 578 | down about 12% |
| Brampton, houses only | 426 | 459 | up about 8% |
So the answer depends entirely on which year you ask. Mississauga still logs more break-ins in total, but its numbers are falling. Brampton logs fewer and its numbers are climbing fast. Add the two together and you get “flat”, which describes neither city.
Two honest caveats on that table. Those mapped counts run below Peel’s official totals, because some records don’t geocode. And the map holds a rolling three years, so the window shifts every time you load it. When we pulled this on August 10, 2026 the oldest record was August 10, 2023, which means 2024 and 2025 were both complete years. Use these for direction, not for precision.
Why the Peel number keeps getting misread
Peel Regional Police covers Mississauga and Brampton together. Statistics Canada reports by police service, not by city, and even labels the geography “Peel Region (Mississauga/Brampton)”.
So every regional break-in figure you read is both cities added up. Mississauga is roughly half the region. Anyone quoting a Peel total as a Mississauga total is off by about double.
Here’s what the region actually logged.
| Peel Regional Police, full year | 2025 | 2024 | 2023 |
|---|---|---|---|
| Break and enters | 2,815 | 2,852 | 2,842 |
| Theft of motor vehicles | 5,280 | 7,231 | 8,322 |
| Robberies | 830 | 997 | 833 |
| Mischief | 4,705 | 4,811 | 4,235 |
| Homicides | 16 | 19 | 23 |
Flat isn’t a win when the rest of the country fell 11%. Statistics Canada scores Peel’s break and enter rate as up 2.0% for 2025, and Peel’s non-violent Crime Severity Index up 11.04%. Violent crime severity actually fell 5.75%. Property crime is what pushed Peel the wrong way.
There’s better news in the current year. Peel’s figures for January 1 to June 30, 2026 show 1,117 break and enters against 1,342 in the same stretch of 2025, and robberies down from 453 to 273. Those are preliminary and get revised, so treat them as a direction, not a scoreboard.
It isn’t only houses
Of Mississauga’s 1,388 mapped break-ins in 2025, 578 hit houses. But 345 hit businesses classed as “other business”, 75 hit stores, 66 hit restaurants and 31 hit construction sites.
Commercial break-ins are more than a third of the total. If you run a shop, a unit or an active site, you’re not a rounding error in this data. That’s what business alarm systems are built for.
Toronto had a strong year, but not everywhere
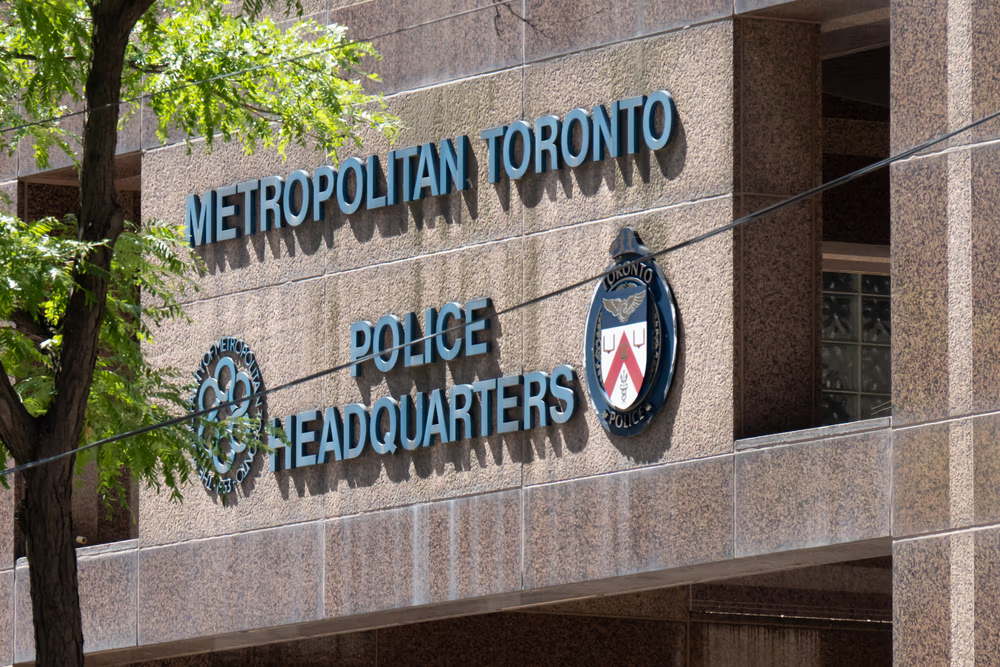
Toronto Police logged 6,092 break and enters in 2025, down 10.7% on the year and roughly 20% since 2023. Auto theft dropped 24% in a single year and is down 42% in two.
The catch is that a citywide average hides a lot. Comparing 2025 against 2024 neighbourhood by neighbourhood, 100 improved, 47 got worse and 11 held flat. We broke that down street level in our Toronto break-in statistics by neighbourhood, and you can look up any of the 158 neighbourhoods yourself on the Toronto crime map, which runs 2014 through 2025 across nine offence types.

What a falling average actually changes for you
Nothing, on its own. A 10.7% citywide drop doesn’t reach your side door. What moves your odds is whether entry takes 30 seconds or five minutes, and whether anybody finds out while it’s happening.
The stuff that reliably matters:
- Time and noise at the entry point. Most house break-ins still come through a door or a ground-floor window. Longer screws in the strike plate, a real deadbolt and a door that doesn’t sit hidden behind a hedge do more than any gadget.
- Somebody watching when you’re not. A siren is a deterrent. ULC-certified monitoring is a response. The difference is whether the alarm just annoys the neighbours or actually gets police dispatched.
- Cameras that cover approach, not just the door. Footage of the back of a hood is useless. Video monitoring pointed at the driveway and the walk-up gives police something to work with.
- Test the system you already own. Plenty of homes in Mississauga and Brampton have panels installed by a company that no longer exists, still armed, still not connected to anyone. We do alarm system takeovers on existing equipment, and we cover both cities: home and business security in Mississauga and security systems for Brampton homes.
- Look like somebody’s home. Daytime break-ins target places that look empty. Lights on timers, no parcels stacking up, no chest-high fence to hide behind.
If your gear is more than a decade old or you’ve never had it checked, that’s the whole job. Start with a home security system that’s actually monitored and go from there.
The short version
Break-ins across Canada are down for a third straight year and drove the biggest part of the drop in crime severity. Toronto had a strong year. Peel bucked the trend entirely, and inside Peel, Mississauga improved while Brampton got worse. The 2026 numbers so far look better for both.
None of that is a reason to panic. It’s also not a reason to skip the deadbolt. Force Security has been doing this out of Niagara Falls since 1988, and we cover Niagara, Hamilton and the GTA. Call us at (844) 360-1234 and we’ll tell you straight whether you need anything.
Sources
- National Crime Severity Index 75.0 (down 4.9%), crime rate 5,585 (down 2.4%), break and enter down 11% and “the largest impact on the decline in the CSI in 2025”, third consecutive decline, motor vehicle theft down 16%, homicide rate 1.61 down 16%. Statistics Canada, The Daily, July 22, 2026: https://www150.statcan.gc.ca/n1/daily-quotidien/260722/dq260722a-eng.htm
- National Crime Severity Index 75.01, down 4.86% in 2025. Statistics Canada Table 35-10-0026-01, released July 22, 2026: https://www150.statcan.gc.ca/t1/tbl1/en/tv.action?pid=3510002601
- Crime Severity Index 2025 by police service and percent change: Toronto 59.98 (down 12.59%), Peel Region (Mississauga/Brampton) 59.41 (up 4.21%), Hamilton 62.21 (down 6.73%), province-wide 57.17 (down 6.20%). Peel non-violent CSI 52.92 (up 11.04%), violent CSI 76.90 (down 5.75%). Statistics Canada Table 35-10-0188-01, released July 22, 2026: https://www150.statcan.gc.ca/t1/tbl1/en/tv.action?pid=3510018801
- Peel break and enter rate up 2.0% in 2025. Statistics Canada Table 35-10-0180-01, geography Peel Region (Mississauga/Brampton), released July 22, 2026: https://www150.statcan.gc.ca/t1/tbl1/en/tv.action?pid=3510018001
- Peel Regional Police full-year counts for 2023, 2024 and 2025, and year-to-date January 1 to June 30 figures for 2025 and 2026 (preliminary, unaudited and subject to revision): https://www.peelpolice.ca/en/in-the-community/crime-statistics-and-maps.aspx
- Mississauga and Brampton mapped break and enter occurrences by year and type. Peel Regional Police public crime map data layer, queried August 10, 2026. The layer holds a rolling 36 months. On the query date the oldest record was August 10, 2023, so 2024 and 2025 were complete years and 2023 is partial and is not used above. Mapped counts run below Peel’s official totals: https://experience.arcgis.com/experience/6eb9c3c452c34ce2b19821de0f6eb775/
- Toronto break and enter and auto theft totals for 2023, 2024 and 2025, and all 158 neighbourhood counts. Toronto Police Service Public Safety Data Portal, Neighbourhood Crime Rates open data layer, queried August 10, 2026: https://services.arcgis.com/S9th0jAJ7bqgIRjw/arcgis/rest/services/Neighbourhood_Crime_Rates_Open_Data/FeatureServer/0 (portal: data.tps.ca)

Pingback: Local Family-Owned Security Company | Hamilton Niagara GTA